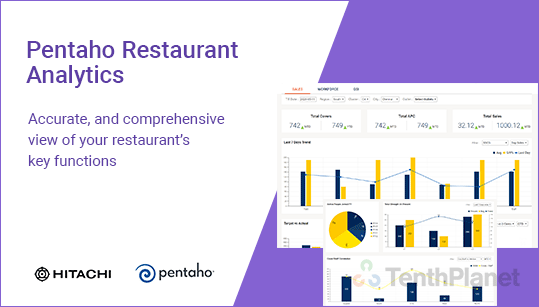
Accurate, and comprehensive view of your restaurant’s key functions
Insights to measure, improve sales, manage staffing, customer retention, table turn over, front-office and back-office activities.
GET IN TOUCH
Monitor sales performance, outlet sales and cover growth
- Total Sales by Day, Month to Date and Year to date
- Total covers by Day, Month to Date and Year to date
- Sales by outlet type
- Same-store sales growth
- Same-store cover growth
- Average sales per cover
- Revenue Share(%) per new and repeat guest
- Revenue % on reservation patterns
- Festival sales
- Sales Target Vs Actual
- Sales correlation – Food vs Beverage, Lunch vs dinner, Veg vs Non veg
Manage operational efficiency of outlets staff
- Active people joined by Financial Year(FY)
- Total strength vs Present by level
- Cover/staff correlation
- Attrition by level
- Staff distribution by levels in the department
- Workforce movement
- Department wise people vs salary(%)
- Sales range bucket distribution by salary %
- Sales range bucket distribution by store %
- Sales range bucket distribution by sale %
- Sales range bucket distribution by people count%
Improve service quality & customer satisfaction
- Guest ratings by month/quarter/year
- Same-store sales growth vs Guest Satisfaction Index(GSI)
- Same-store cover growth vs Guest Satisfaction Index(GSI)
- No of turns vs Guest Satisfaction Index(GSI)
- Guest Satisfaction Index during the festival
- Guest satisfaction index by session(timings)
- Guest satisfaction index for guest aging
- Guest Satisfaction Index during Festival
- Guest Satisfaction Index snapshot by Month to date(MTD), Last Quarter(Lqtr), Last 2 years high (L2 yrs)
- Last 6 months weekly Guest Satisfaction Index
- Urgent calls on feedback
Accurate, and comprehensive view of your restaurant’s key functions
