Pentaho Dashboards
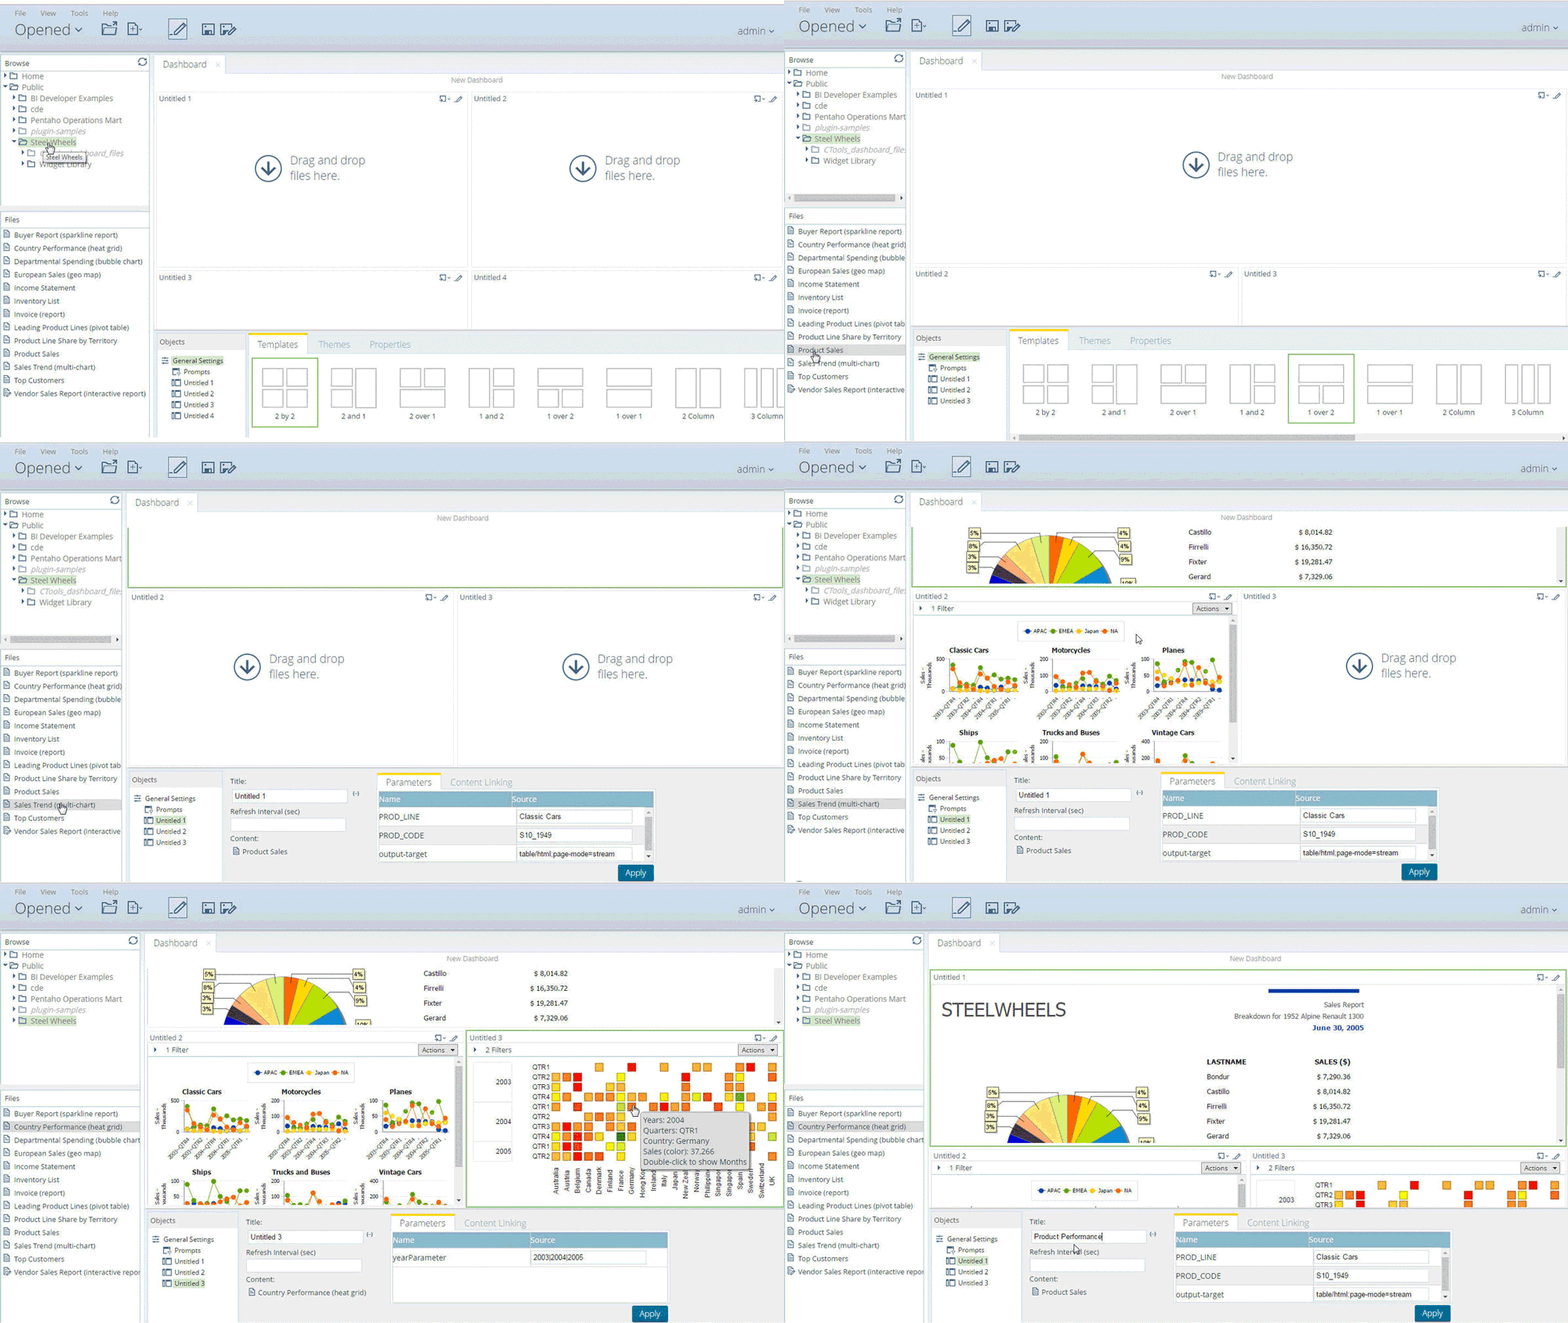
Easy to read, one page summary of the analysis of information, get an overview of your enterprise in a centralized view. Dashboards provide the most valuable and useful set of information. Visualizing insights from information provides a consolidated and easy to interpret representation. Key performance indicators of an enterprise can be measured and monitored using dashboards. Dashboards are primarily built to provide necessary inputs to decision-makers from the single point of truth.
- Drag and Drop Designer provides flexible options for decision-makers to configure what they wish to monitor at that point in time
- Multi-device and responsive, decision-makers on the go can start using tablets, mobile phones to view dashboards on the go
- Macro-level visualization with complete interactivity and filtering to drill down into micro-level details when required
- Powerful visuals including Geo and spatial analysis connected to the latest consolidated data to assist decision-makers
- Export and share as PDF
Pentaho Dashboard Features
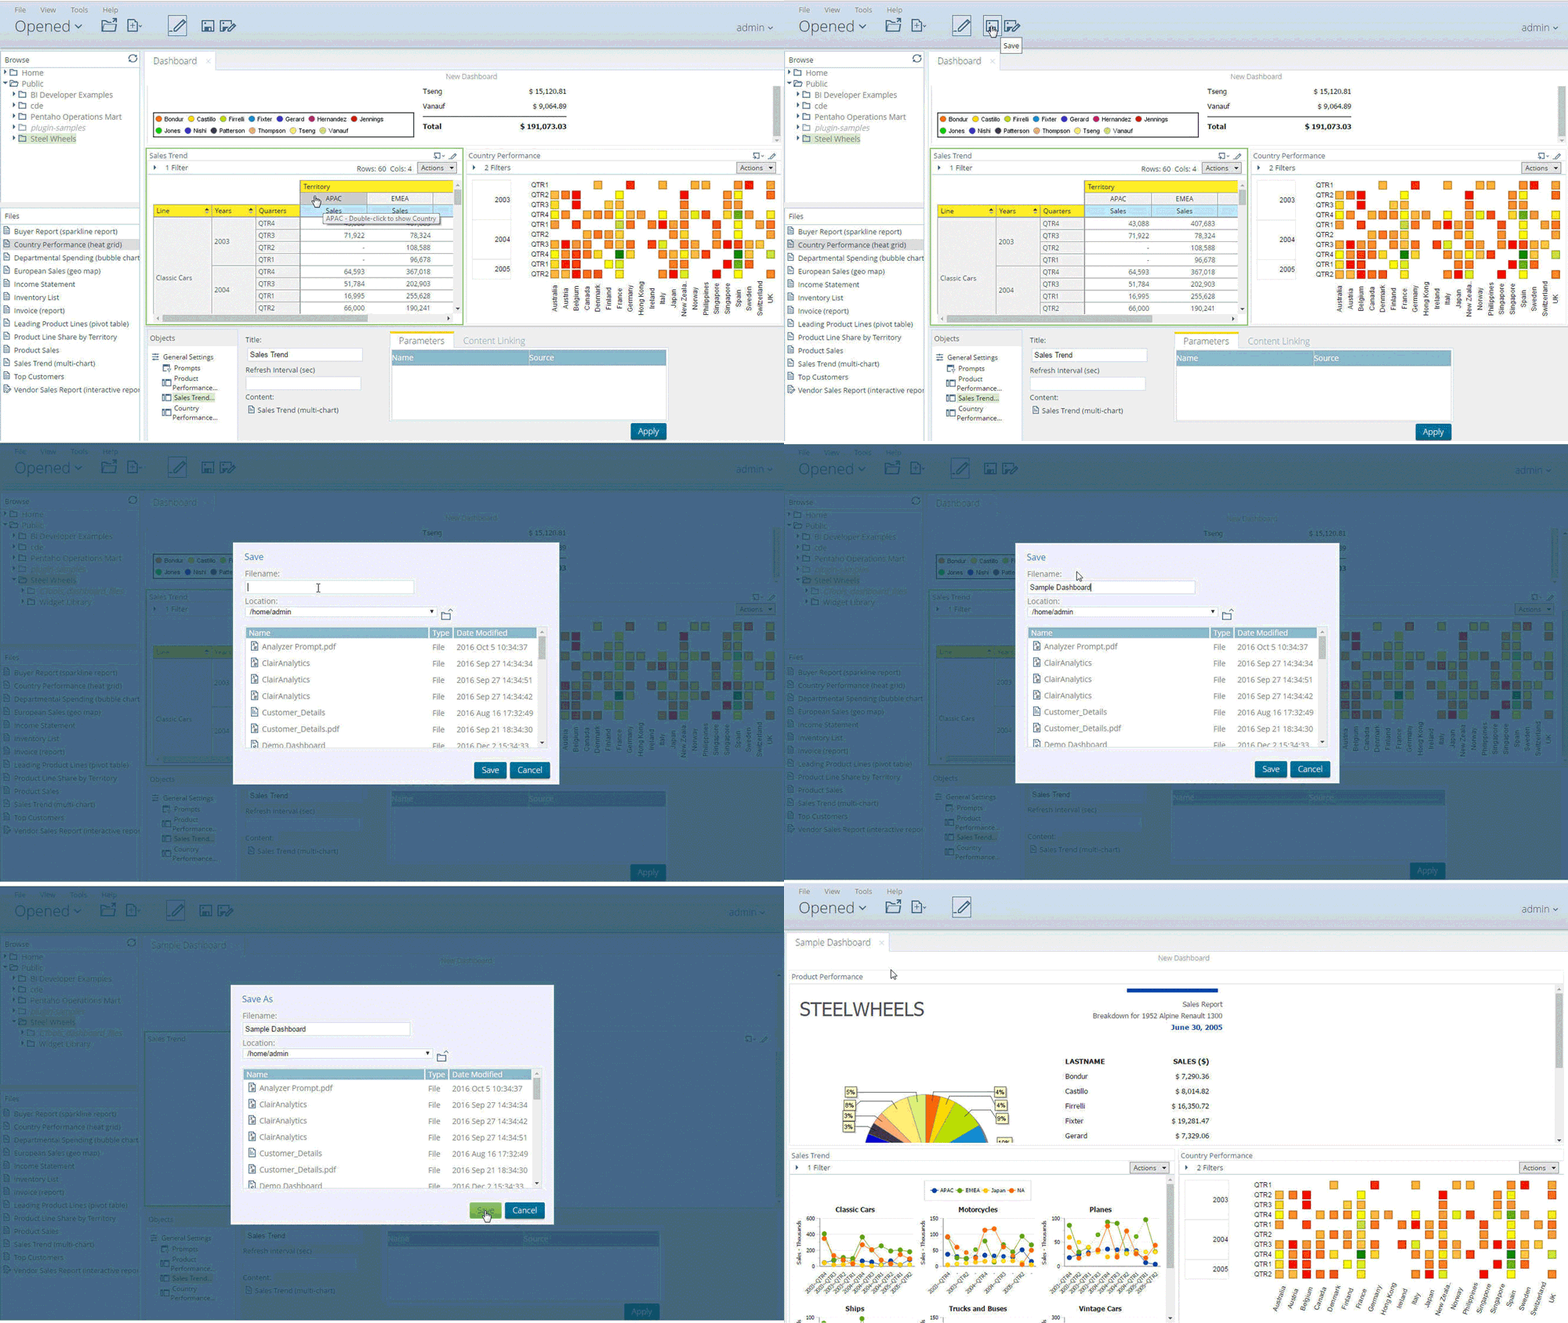
Store for future reference

Interface to view different reports at once

