How to Filter, Search and Group the Move Analysis Report Data in Odoo Inventory
The Move Analysis Report in Odoo is a helpful tool that shows detailed information about product movements, whether items are coming into your warehouse, going out, or moving between locations. This report makes it easier to monitor stock activity and understand how products are flowing through your inventory. Below is a simple guide to help you search, filter, group, and save your report settings.
Accessing the Move Analysis Report
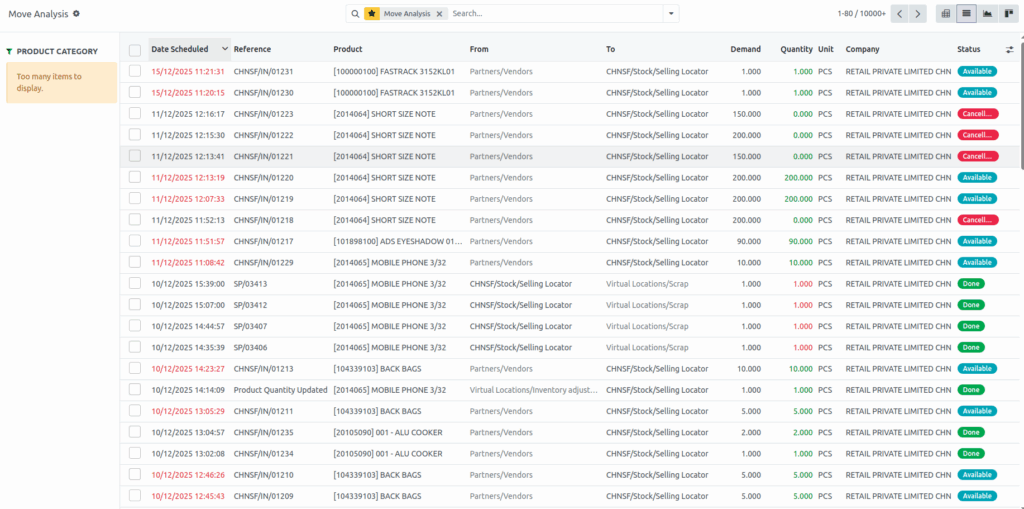
To open the Move Analysis Report, go to the Main Menu and select Inventory. Then click on
Reporting and choose Move Analysis Report. After the report loads, you can use the search bar at the top to look for specific details. You can search by location to find movements linked to a certain warehouse or facility, or by product to view stock movement for a particular item. If you know the reference number of the transaction, you can use that as well. The report also allows you to search by source and destination locations to understand where a product started and where it ended up. Searching by partner helps you see movements connected to a specific customer, vendor.
Using Filters and Date Options to Refine Results
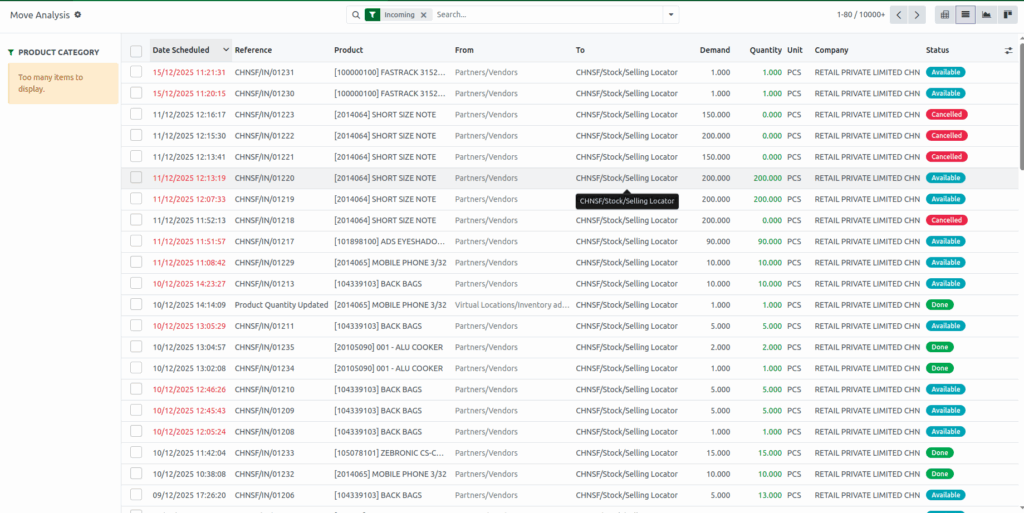
Filters make it easy to display only the information you need. By clicking the dropdown icon near the search bar, you can filter by Done to show completed moves, Ready to show items prepared for the next action, and To Do for moves that are still pending. You can also filter by types of stock movement such as Incoming for products entering inventory, Outgoing for products leaving, and Internal for movements happening between company locations.
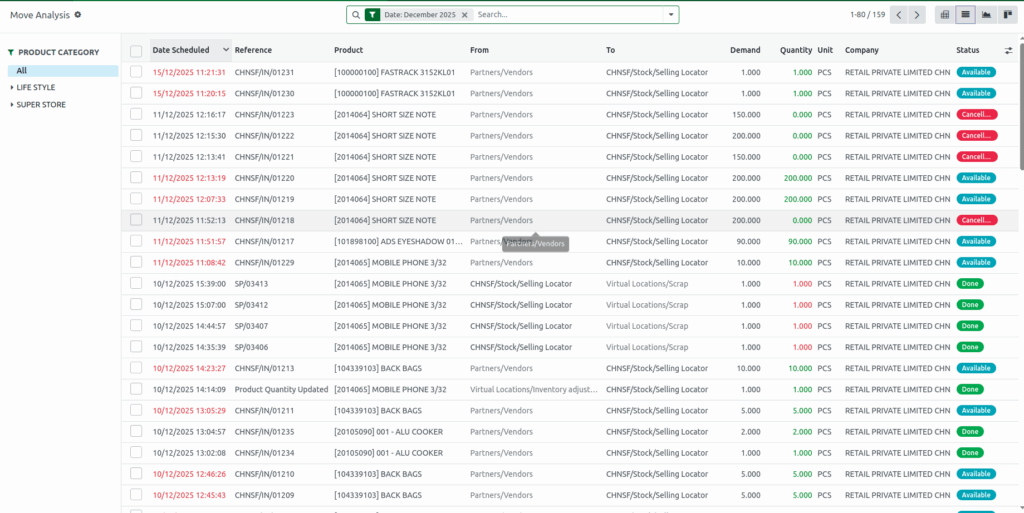
For time-based filtering, you can use the Date dropdown in the Filters section. Options include the last three months, quarterly periods from Q1 to Q4, and the last three years. If you want something more specific, you can click Add Custom Filter, where a popup allows you to select a field, choose a condition like “is equal to” or “contains,” and then enter the value you want. Once added, the report updates instantly based on your filter.

Grouping Move Analysis Data for Better Understanding
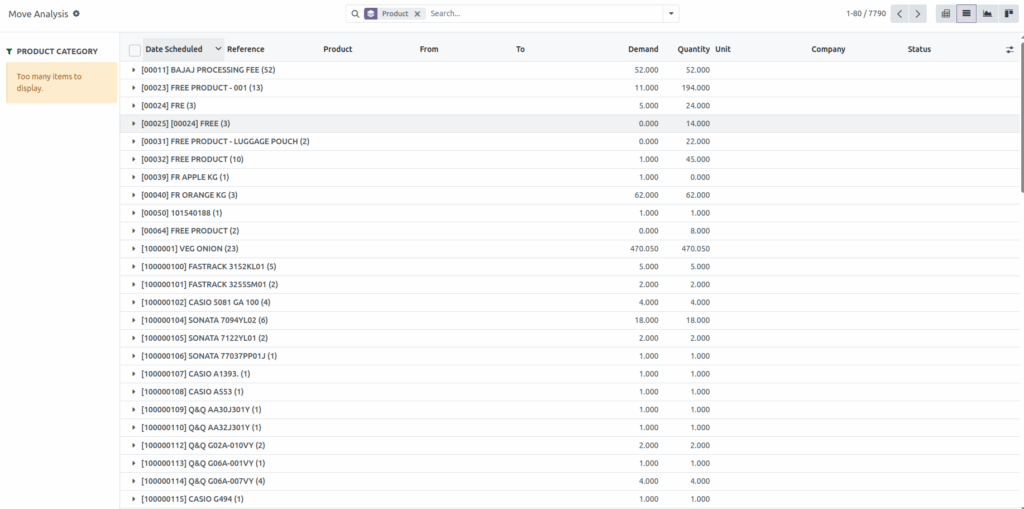
Grouping helps you organize your Move Analysis Report in a way that is easier to read and analyze. By clicking the dropdown icon and selecting Group By, you can choose from default grouping options. Grouping by Product shows the movements of each item, while grouping by Operation Type helps you see actions like picking, packing, or shipping. You can also group by Picking to organize data by picking batches.
Additional grouping options include grouping by Source Location to see where items originated from, and Destination Location to see where they were delivered. Grouping by Status helps you check whether movements are pending or completed, and grouping by Scheduled Date helps you track planned movement dates. If you need to group by a different field, you can select Add Custom Group and choose from the available fields.
Saving Favorite Report Views
If you often use the same filters or groupings, the Favorites option helps you save time. After setting up your preferred search, filters, or groupings, open the Favorites menu and choose Save Current Search. You can name your saved search and even set it to load automatically every time you open the Move Analysis Report. This makes it easy to return to your preferred view without rebuilding it each time.