How to view the Weekly Sales Report in Odoo POS
The Weekly Sales Report in Odoo POS is a useful tool for tracking your sales week by week. It gives a clear picture of which products are selling, how many units were sold each week and the total sales for the month. With this report, users can see how products are selling week by week and compare performance across different weeks.
Accessing the Weekly Sales Report in Odoo POS
To open the report, go to the Point Of Sale module from the main dashboard. Then click on Reporting, and select Weekly Sales Report from the list.
Searching, Filtering and Grouping the Weekly Sales Report Data
The Weekly Sales Report can be easily filtered, grouped, and searched to make analysis simpler. You can filter sales data by Week, Product Name, Product Code, Quantity Sold or Total Units Sold.
You can also organize the report by grouping the data based on Product Name, Product Code, Month making it easy to spot trends and compare performance across different products and weeks.

Then, the Search feature allows you to instantly find specific products using the Product Name or Product Code.
Weekly Sales Report Scheduler
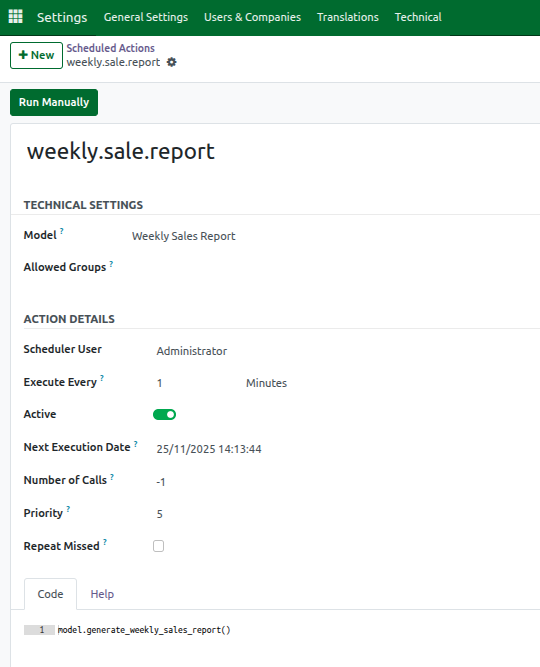
The Weekly Sales Report in Odoo POS is supported by a scheduler that automatically updates the weekly quantity sold data to keep the report accurate and current.
The scheduler can be run in two ways: manually, by clicking the Run Manually button or automatically, based on the configured next execution date and time. It processes only completed POS orders that are in the Posted or Invoiced states, ensuring that only finalized sales are included in the weekly totals.
To access the scheduled action, go to the Settings app, then navigate to Technical → Automation → Scheduled Actions. Here, you will find the scheduled action for the Weekly Sales Report listed under the name weekly.sale.report, which handles the automatic updates of weekly product sales quantities.
Weekly Sales Report Key Details
The Weekly Sales Report in Odoo POS provides detailed insights into sales through several key fields. The Product Name field shows the name of each product sold, while the Product Code displays the unique code associated with each item, helping with easy identification. The Month field indicates when the products were sold and if a product is sold in multiple months, it will appear on separate lines for each month, clearly showing the respective month.

The Weekly Quantity Sold field displays the number of units sold for each week, from Week 1 to Week 5, in separate columns. This data is automatically updated by the scheduler to ensure accuracy. Finally, the Total field calculates the sum of quantities sold across all weeks in the month, giving a clear overview of overall sales for each product.
Viewing and Analyzing the Weekly Sales Report
The report can be viewed in list, pivot, or graph formats. List view displays sales in a table format that can be sorted by columns. Pivot view allows grouping by different fields and analyzing multiple weeks at once. Graph view shows sales visually, using bar, line, or pie charts, and can be customized for stacked or cumulative views.

Exporting Weekly Sales Report for Further Analysis
The Weekly Sales Report can be exported to Excel for further analysis. By clicking the Actions (gear icon) and selecting Export All, users can download the report, including any filters or groupings applied. The exported Excel file includes headers such as Company Name, Created By (user who exported the report), and Created On (date and time of export), allowing for easy offline review, sharing, and analysis of the sales data.