How to Filter, Search, and Group the Product Performance Report in Odoo POS
The Product Performance Report in Odoo POS offers a detailed view of product performing across different sales operations. It shows sales trends, customer activity, product movement, and overall performance based on several product and order-related factors. Odoo provides easy-to-use tools to search, filter, and group the data so the report can be analyzed from different angles.
Accessing the Product Performance Report
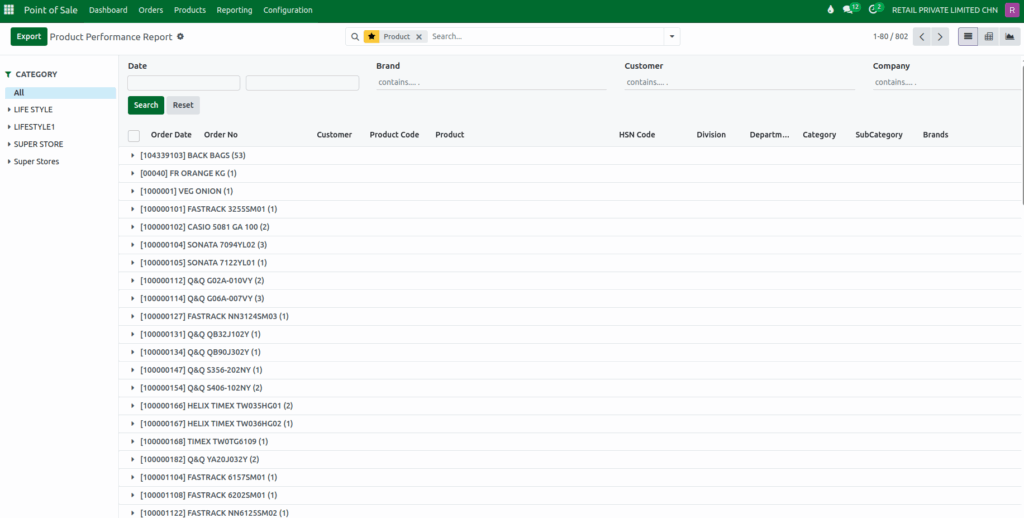
To access the Product Performance Report, start by navigating to the Point of Sale module from the main menu. Once the POS dashboard opens, go to the Reporting menu under the Advanced Reports, select the Product Performance report. After opening the report, all product performance details are displayed in a structured format.
Using Quick Search Filters
Quick search filters make the Product Performance Report easier to refine and analyze. The date range option allows selecting a starting and ending date so the report displays results only for that specific period. The brand filter helps narrow the report to products belonging to a particular brand, while the customer filter makes it possible to show sales linked to a specific customer.

The company filter allows choosing the relevant company when multiple companies operate within the system. After setting the filters, clicking the search button displays the results instantly. You can apply multiple filters at the same time for more precise analysis, and if you want to clear everything and start fresh, the reset button removes all selected filters.
Using the Search Bar in the Product Performance Report
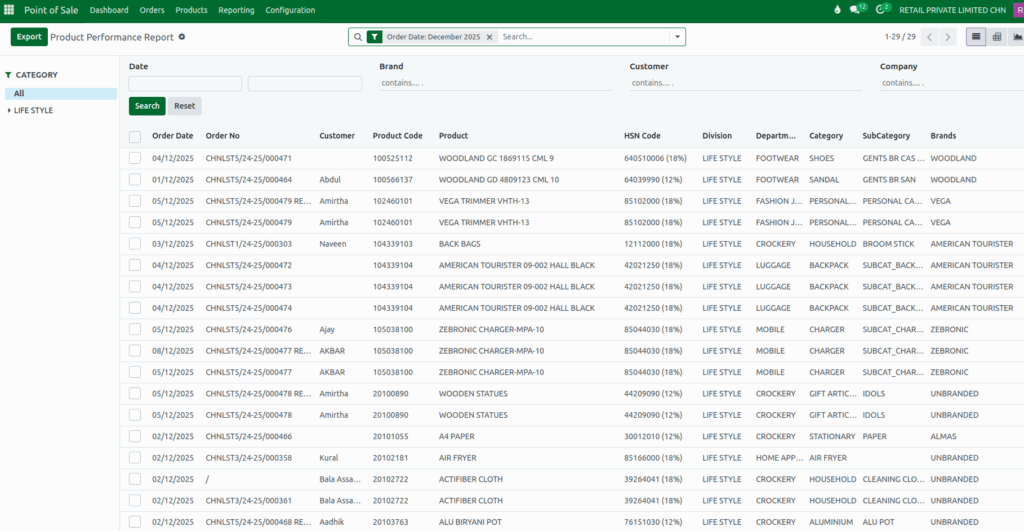
The Product Performance Report includes a search bar that helps locate information quickly based on several fields. The product name can be entered to view performance for a specific item, while the product code helps find products using their unique identification number. Transactions can be located using the order number, and customer-related sales can be viewed by searching for the customer’s name.

Searching by HSN code allows the report to display products grouped by their tax classification. Products can also be searched by division to focus on broader business units, or by department to narrow down results within each division. Searching by category and subcategory makes it easy to analyze products based on their product hierarchy. Brand search is available as well, helping review the performance of items belonging to a specific brand. This range of search options ensures the report can be explored from multiple angles for better clarity and detail.
Filtering the Product Performance Report
Filters are available through the dropdown icon in the search bar. These include filters like GST Invoice for displaying transactions linked with GST invoicing, Retail for isolating retail sales, Lifestyle for lifestyle-related products, and Superstore for items under the superstore category.
By default, the report displays only today’s data unless this filter is changed. The report also allows filtering by order date using the order date dropdown. This section provides several time-based options such as the last three months, quarterly periods including Q1 to Q4, or sales from the last three years. There is also an option to select a specific month, with the year updating automatically. These time filters are useful for analyzing product performance over short, medium, or long periods.
Applying Custom Filters for Detailed Reporting
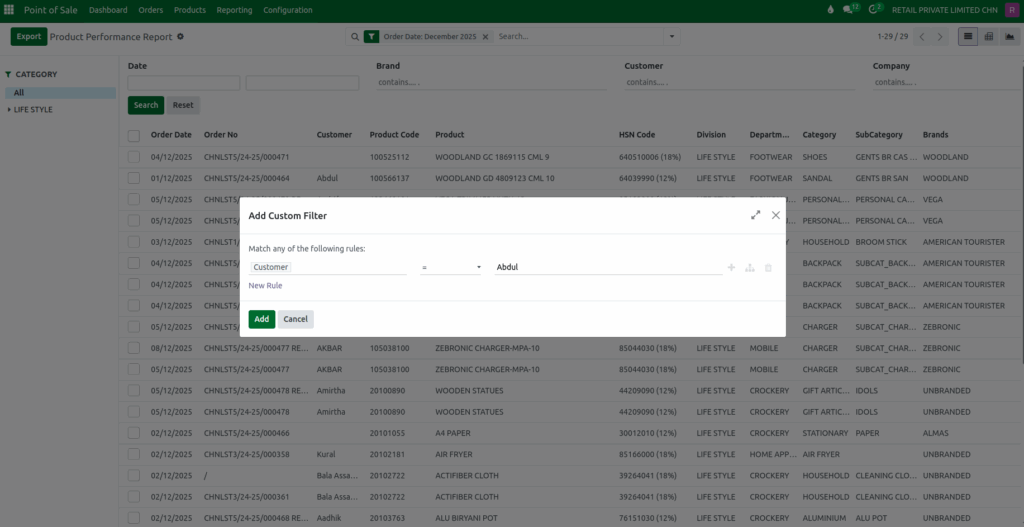
For more detailed analysis, the system allows you to create your own custom filters. When you click the option to add a custom filter, a popup window gives you a rule that you can modify. You can select the field you want to filter by, such as customer, choose how the filter should behave, such as matching or containing a value, and then enter the value itself. After clicking add, Odoo automatically updates the report to show only the data that meets your selected conditions.
Grouping Product Performance Data
The Product Performance Report provides several Group By options that help organize sales data in a structured way. The Group By option in the dropdown menu allows the report to be arranged according to different fields. Grouping by company shows results based on the company handling the transaction, while grouping by product organizes the data by each item sold.
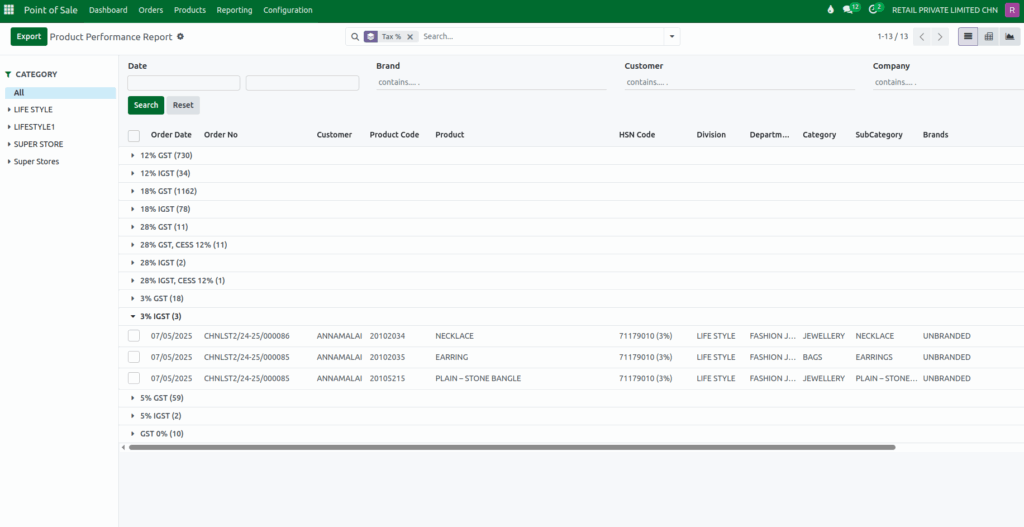
The brand option arranges the report according to product brands, and grouping by HSN code displays products based on their tax classification. Data can also be grouped by tax percentage to compare sales involving different tax rates.
The division and department options help separate results according to business units and their sub-sections, and grouping by category or subcategory presents product performance based on the product hierarchy. The report can also be grouped by order date, with options to view data by year, quarter, month, week, or day, allowing trends and patterns to be examined over different time periods.
Applying Custom Grouping
Odoo also allows creating custom groups. Clicking the option to add a custom group opens a list of additional fields you can use for grouping. Choosing one of these fields helps you organize the report in a way that fits your specific business needs. With custom grouping, you can view the data from different angles and get clearer insights into product performance report.
Saving Favorites for Quick Reuse
Odoo lets filters be saved for quick use later. To save a filter, open the dropdown menu, choose “Save current search,” and give it a name. It can also be set as default or shared with others. Saved filters can be reused anytime, and unwanted filters can be deleted using the trash icon. This makes it easy to use the same filters again without setting them every time.