How to view the Odoo Move Analysis Report in Inventory
The Move Analysis Report in Odoo Inventory gives a clear and detailed view of all stock movements happening inside the company. It includes every type of movement such as incoming receipts, internal transfers, and customer deliveries. This report helps businesses understand how products are moving across locations, check warehouse efficiency, identify delays or bottlenecks, and support planning for future stock needs.
Access and Navigation
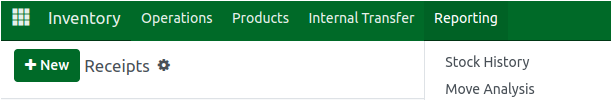
To open the Move Analysis Report, users need to go to the Inventory module from the main dashboard, click on Reporting, and select Move Analysis Report. This report is usually available to Inventory Managers or users with reporting permissions.
Search, Filter, and Group Options
Once the report opens, users can search for specific records using keywords related to the location, product, reference number, source location, destination location, or partner. These search options help quickly locate any stock movement linked to vendors, customers, or internal warehouse locations.
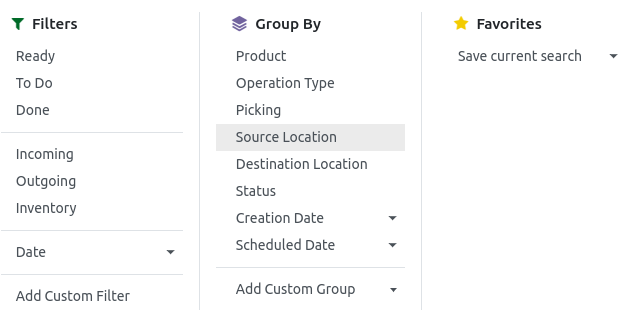
Several filter options are available to refine the data, such as Ready, To Do, Done, Incoming, Outgoing, Inventory, and Date filters. The Done filter is usually applied by default. If users need more specific results, they can add custom filters based on fields like category, company, created date, bill number, scheduled date, and many more.
Grouping features help organize records into meaningful sections like product, operation type, picking, status, source location, destination location, creation date, or scheduled date. Custom groups can also be added when needed. Favorite filters can be saved so users can reopen the same view anytime without setting filters again.
Understanding Report Fields
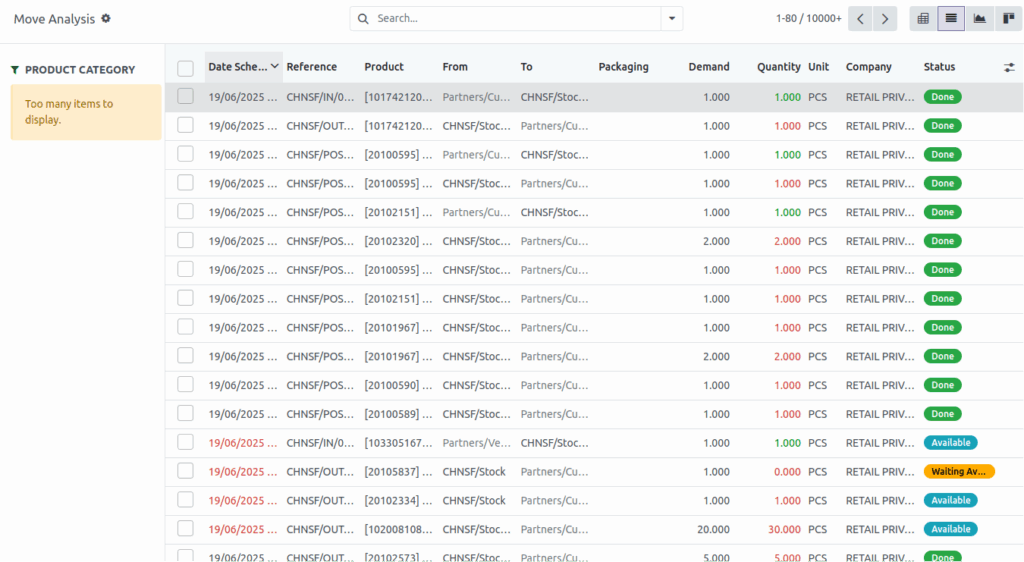
The Move Analysis Report displays several important fields that explain each stock movement. It shows the scheduled date of the transfer, the reference number, the product name, and the source and destination locations involved in the movement. It also shows packaging details, the demanded quantity, and the actual quantity moved.
Additional fields like unit of measure, company name, and the status of the movement provide more clarity. Statuses like Done, Cancelled, Available, Partially Available, and New help users understand the progress of each transfer. These details help track stock accuracy and identify issues like shortages or incorrect stock movements.
Views and Visualization
The report can be viewed in different formats based on user needs. The default view is the Pivot View, which helps summarize and compare stock data across multiple dimensions. Users can drag and drop fields such as source location or destination location and choose multiple measures to analyze the information. The List View presents the data in a table format, allowing users to sort columns and view records clearly in rows. The Graph View provides visual charts like bar, line, and pie charts for better comparison and trend analysis, with options for stacked or cumulative views and sorting preferences. For more visual tracking, the Kanban View shows each record as a card, making it easy to browse through movements one by one.
Export Options
Users can export the Move Analysis Report using the Export All button in List View or the Download XLSX option in Pivot View. Exported files are usually downloaded in Excel or CSV format, making them useful for auditing, analytics, or sharing with management teams.