How Requests for Quotation Screen Details are Displayed in Different Views in Odoo Purchase
Odoo Purchase provides several ways to view and analyze Requests for Quotation (RFQs). Each view shows the same information but in a different format, helping users choose the layout that best suits their workflow. Each views displays RFQ details in a clear and organized way, making it easier for users to monitor their purchasing activities.
Details in the List View
In the List view, Odoo displays RFQs in a clean table format where each row represents a single quotation request. This view includes details such as RFQ reference, vendor name, company, purchase representative, order deadline, activities, and amounts like untaxed total and complete total.
The status and billing status are shown using colored labels, making them easy to identify at a glance. You can also star important RFQs to keep them at the top of your personalized list. This view is best when you need detailed insights and want to compare multiple RFQs quickly.

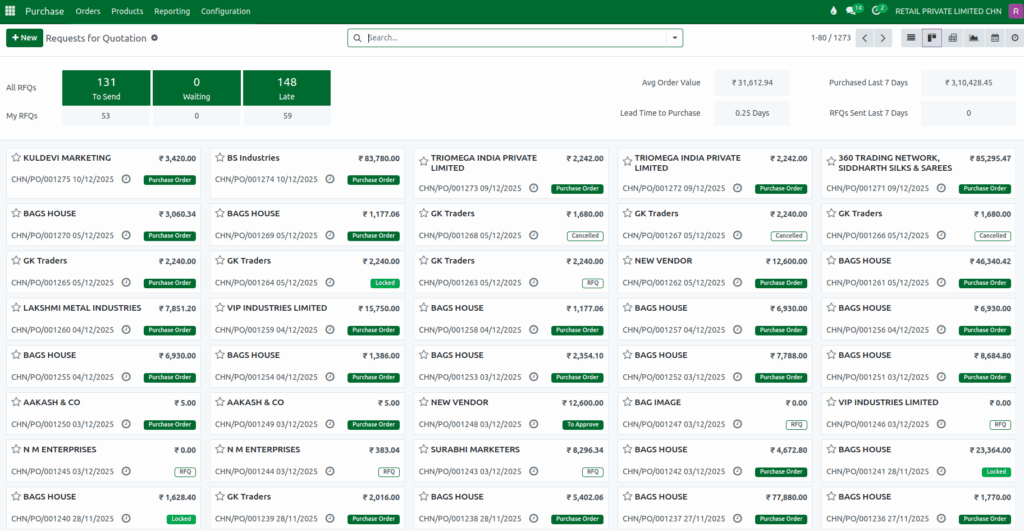
Details in the Kanban View
The Kanban view shows the RFQs in card format. Each card displays key details like vendor name, total amount, RFQ reference, date, and current status. The status is shown on colored tags such as Purchase Order, Cancelled, Locked, RFQ, and To Approve.
The Kanban layout gives a clean and visual overview, making it easy to scan through RFQs without reading line-by-line details. This view is useful for teams that prefer a visual style of working and want quick access to important information.
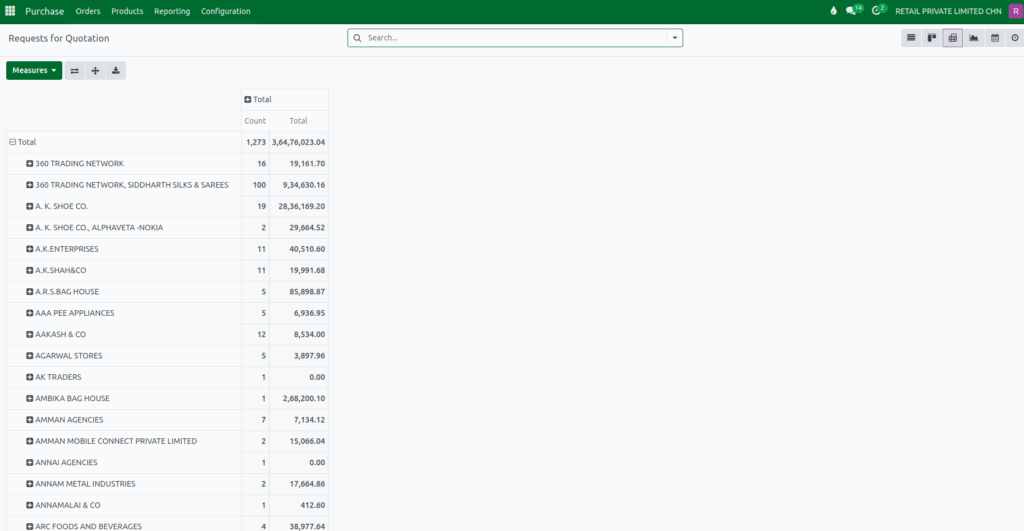
Details in the Pivot View
The Pivot view allows users to analyze RFQs using grouped data. It organizes information in a grid format showing totals, counts, and vendor-wise summaries. The view helps users understand purchasing patterns such as total value purchased from each vendor and the number of RFQs created.
Users can expand or collapse rows to view more or fewer details. This view is helpful for purchase managers who want to analyze data, review performance, and generate reports directly from the screen.
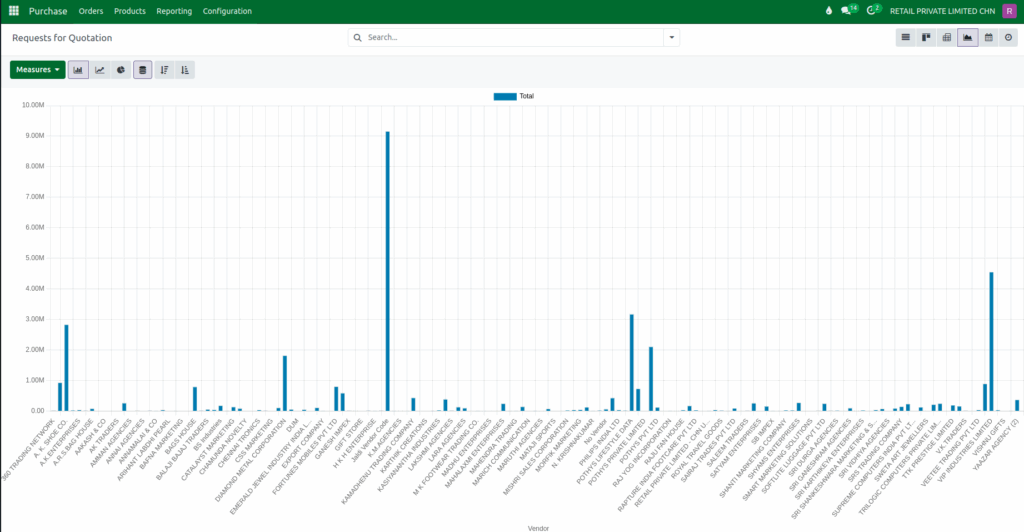
Details in the Graph View
The Graph view offers a visual analysis of RFQ data using bar charts, line charts, or pie charts. It helps buyers quickly identify purchasing trends by grouping information such as total purchase amounts, number of RFQs, vendor-wise performance, or product-wise demand.
By converting raw RFQ data into visual patterns, the Graph view makes it easier to compare vendors, track spending over time, and understand procurement behavior, supporting better decision-making in the purchasing process.
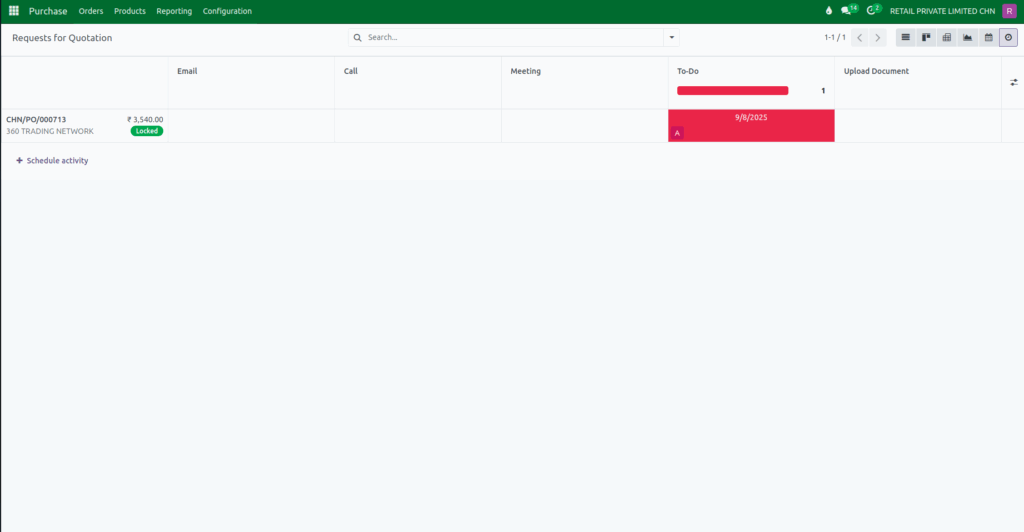
Details in the Calendar and Activity Views
The Calendar view provides a time-based perspective of RFQs by displaying details such as the PO document number, vendor name, PO creation date, vendor reference, and total amount. By presenting this information directly on specific dates, it helps buyers monitor upcoming deadlines, track order-related events, and manage timelines efficiently to prevent delays.

The Activity view displays all scheduled actions related to each RFQ, such as follow-up calls, reminders, or document reviews, ensuring that communication and responsibilities are clearly tracked. Both views support better coordination and ensure that no important purchasing task is overlooked.