How to Filter, Search and Group the Hourly Sales Report in Odoo POS
POS Hourly Sales Report will display Hourly Sale Report of POS Orders. For example it will show, how many pos orders are created in particular hour. The POS Hourly Sales Report is a powerful tool designed to provide businesses with real-time insights into their point of sale transactions. This feature allows users to generate a comprehensive report that breaks down sales data on an hourly basis, offering a detailed analysis of sales performance throughout the day.
To view the Hourly Sales Report, follow these steps: Point of Sale -> Reporting ->Hourly Sales Report
Default Filter
The Today Method is the default filter. It shows sales broken down by hour for the current date, allowing you to quickly track daily sales trends.

Quick search
The Quick Search bar allows users to instantly filter and locate sales data using keywords or field-specific criteria. The following fields are supported for quick search in the Hourly Sales Report:
- Date: Enter a specific date (e.g., 2025-06-15) or relative terms like Today, Yesterday, or Last 7 Days to quickly filter the report by time.
- Company: Type the name of a company to instantly narrow down the report to show sales data for that specific company. This is particularly useful in multi-company environments to avoid navigating through the filter menu.

Filter
In the Hourly Sales Report, you can refine your data using the following filters:
- Last 30 Days: This filter allows you to display POS transactions from the last 30 days, organized by date and time for easy tracking.
- Date: Allows user to select a specific date or date range to view sales that occurred within that time frame. This helps in analyzing trends or comparing performance over different days.
- Today: A quick filter that automatically selects the current date. Useful for monitoring real-time sales performance throughout the day.

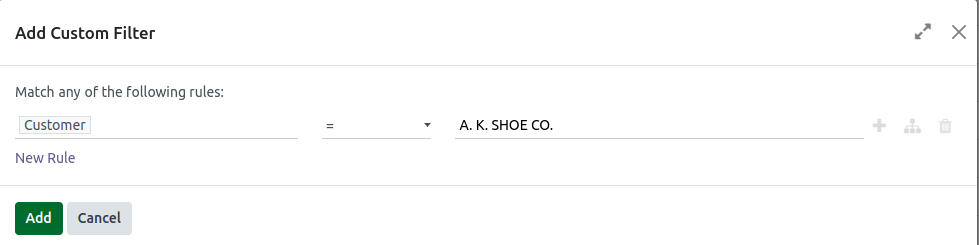
Using Custom Filters
To apply additional filters, click Add Custom Filter, which will open the Custom Filter popup. Click on ID to view the available filters, then choose the filter you want, such as Customer or Last Order Date. Next, select the appropriate operation, for example, is in, =, !=, or contains, and enter or choose the value based on the filter selected. Finally, click Add to apply the custom filter.
Group By
The Group By feature allows you to organize sales data based on selected categories for easier analysis. The following grouping options are available:
- Company:Groups sales data by company. This is useful in multi-company environments to compare performance between different legal entities or branches.
- Status:Groups the report based on the sales order status (e.g., Confirmed, Draft, Invoiced, Cancelled). Helps track the flow of sales orders and identify bottlenecks or pending actions.
- Date: Organizes sales data by date, allowing you to analyze trends on a daily basis. Combined with hourly segmentation, it’s useful for spotting sales patterns across different days and time periods.

Custom Grouping
Click the ▼ (dropdown) icon in the search bar. Click Add Custom Group.
- A list of group-by fields will appear(Customer, Status).
- Select one to group your report accordingly.