How to view the Hourly Sales Report in Odoo POS
Tracking sales in real time is important for any business, and Odoo makes it easy with the Hourly Sales Report. This report helps businesses see how many sales were made during each hour of the day. It provides insights into peak sales hours, overall sales performance, helping managers make data-driven decisions about staffing, inventory, and promotions.
Accessing the Hourly Sales Report in Odoo POS
To open the report, go to the Point Of Sale module from the main dashboard. Then click on Reporting, and select Hourly Sales from the list. By default, the report displays sales data for the current day, giving you an instant view of daily performance.
Filtering, Grouping, and Quick Search in the Hourly Sales Report
Odoo’s Hourly Sales Report lets you refine and organize your sales data for easier analysis. You can filter the report by Date to view sales for a range of days, by Today to quickly see the current day’s sales, check sales from the last 30 days or by Company if you manage multiple branches.
You can also organize the report by grouping the data based on Company, Sales Status or Date. This makes it easier to compare performance across different branches, track the progress of sales and spot trends over time.

A Quick Search bar is also available, allowing you to instantly find sales data. You can search by the date range or by company name to focus on a specific branch.
Hourly Sales Report Key Details
The Hourly Sales Report shows key information about each hour of the day. The Date field indicates the day of the sale, while the Hours field shows the specific hour in which sales occurred. The Taxable Amount reflects the total sales amount before taxes, and the Total Amount includes taxes to show the final revenue for that Hour.
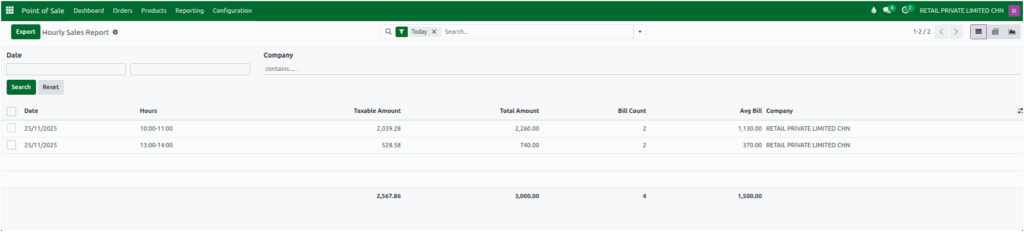
The report also shows the Bill Count, which is the number of sales transactions during that hour, and Avg Bill, which is calculated by dividing the Total Amount by the Bill Count. This helps understand customer spending habits. The Company field identifies which company or branch made the sales helping track performance across multiple location, which is important for businesses with multiple branches.
Viewing and Analyzing Sales Data
Odoo offers several ways to view and analyze hourly sales data. The List View displays all total sales count in a table format. The Pivot View allows you to group and summarize data, which is helpful for spotting trends and comparing performance across hours. The Graph View presents sales visually using charts, making it simple to identify peak sales hours and understand overall sales patterns throughout the day.
Exporting Hourly Sales Report for Further Analysis
The Hourly Sales Report can be exported in Excel format for offline analysis. You can apply filters and select specific fields before exporting, allowing you to review, share, or integrate sales data with other tools. This makes it easier to make informed business decisions based on accurate hourly sales information.