How to View the Stock Valuation Report in Odoo Inventory
The Stock Valuation Report in Odoo is a useful tool for keeping track of your inventory. It shows all the stock movements, including what has been added, removed, transferred internally, or adjusted. This report also helps calculate the total value of your products and monitor stock levels over a specific period. By summarizing all transactions, it gives a clear view of inventory performance and ensures accurate reporting.
Accessing the Stock Valuation Report
To open the Stock Valuation Report, go to Inventory Management > Reporting > Basic Reports > Stock Valuation Report. Only users with the Inventory Manager role can access this report. Once opened, the report allows you to see all stock movements, including incoming and outgoing stock, internal transfers, adjustments, and the total value of your inventory

Using the Quick Search and Filter
When generating the report, a Quick Search and Filter pop-up will appear. Certain fields are mandatory, including Product, Warehouse, From Date, and To Date. If any of these are left empty, the system will show a message specifying which field is missing. You also need to select the company to view stock for products located under that company.
You can filter the report either by Product or Category. By default, the Product option is selected. If Product is chosen, you can select one or more products to include. If Category is selected, you can pick a product category to include all items within that category.
You also need to choose a warehouse and a date range to define the period for which the report will be generated. The system provides options to print the report in Excel or view it in a tree format for a hierarchical view of stock details.

Understanding the Fields in the Report
The Stock Valuation Report shows many details about your inventory. When using Tree View, the report displays the selected date range on the left and the warehouse location on the right. It lists products based on your chosen filter, along with product codes, names, department, category, sub-category, and brand.

The report also shows important stock information. Opening Stock is the quantity available at the start of the reporting period, and its value is calculated by multiplying the quantity by the product cost. Incoming Stock and Outgoing Stock display the quantities received and issued during the period, along with their calculated values. Internal Stock shows transfers between warehouses, and Adjustment Stock reflects any corrections made. Ending Stock shows the quantity available at the end of the period and its total value.
• Opening Stock Value = Opening Stock Quantity × Cost PriceI
• Incoming Stock Value = Incoming Stock Quantity × Cost Price
• Outgoing Stock Value = Outgoing Stock Quantity × Cost Price
• Internal Stock Value = Internal Stock Quantity × Cost Price
• Adjustment Stock Value = Adjustment Stock Quantity × Cost Price
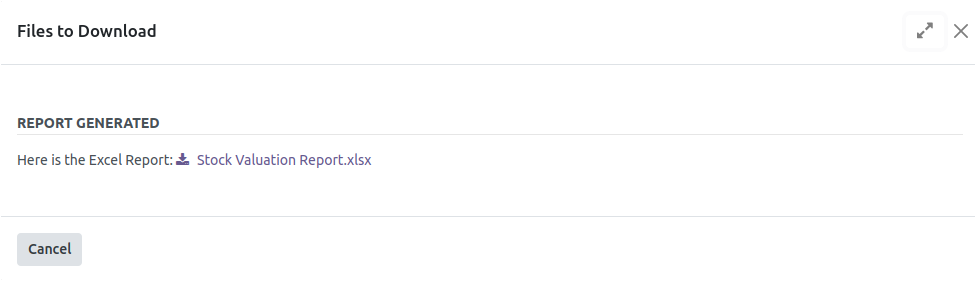
• Ending Stock Value = Ending Stock Quantity × Cost PriceGenerating and Viewing the Report in Excel
If you choose to print the report in Excel, all the fields from the tree view are included. The Excel report adds the Company field and renames the location field as Warehouse.
The report in Excel is titled Inventory and Stock Valuation Report. This makes it easy to share or analyze stock data outside Odoo.