How to View the Valuation Report in Odoo Inventory
The Stock Valuation Report in Odoo Inventory shows the value of the products stored in your warehouse. It includes details like product cost, total stock value, remaining quantity, and lot or serial information. This report is important for understanding inventory worth, planning purchases, and meeting business or accounting requirements. It helps management keep track of how stock value changes over time and provides clarity for financial reporting.
Accessing the Valuation Report
To open the Stock Valuation Report, go to Inventory → Reporting → Valuation. Only the Inventory Manager has permission to access this report. Once opened, you can view all product movements, such as purchased items, sold items, and remaining stock, along with their calculated values. This makes it easy to understand how much your inventory is worth at any point in time.

Using Filters, Grouping, and Quick Search Options
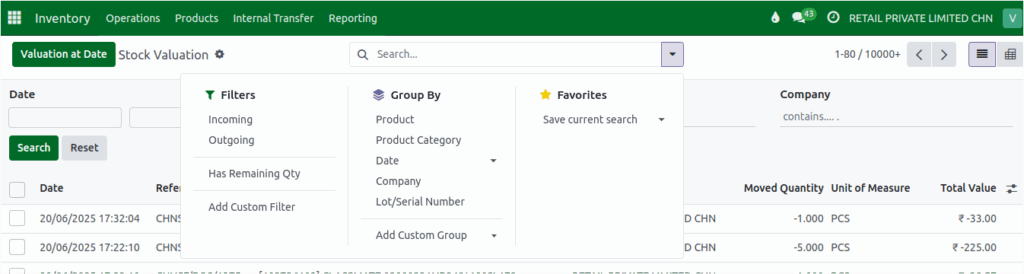
The report offers useful filter options like Incoming, Outgoing, and Has Remaining Quantity. The Incoming filter shows purchased products with their order numbers, while the Outgoing filter displays sold products. The Has Remaining Quantity filter lists products that still have stock available. These options help you focus only on the data you need.
The Group By menu allows you to group data by fields such as Product, Product Category, Date, Company, and Lot/Serial Number. For example, grouping by Product will show all movements related to each individual product, while grouping by Company helps identify stock movements across multiple business units. You can also create Custom Filters and Custom Groups if you want to include additional fields like Stock Move, Total Value, Company Name, or Created By.
A Quick Search bar is available to instantly search by Categories, Brand, or Company. You can also search by Product name or filter data for a specific date range, making it easier to find transactions without going through multiple options.
Understanding the Fields in the Stock Valuation Report
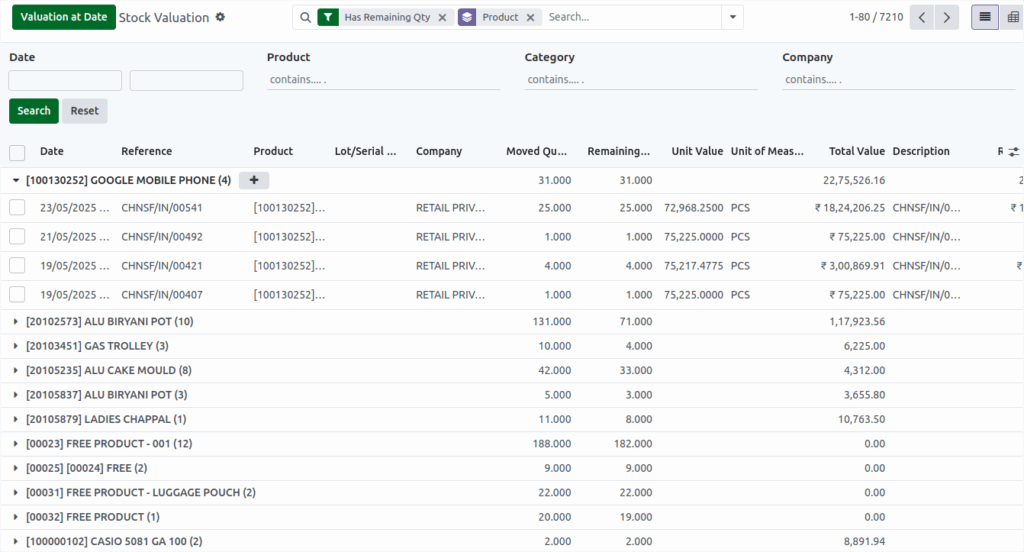
The report displays important details about each product movement. It shows the Date, which indicates the transaction date and time, and the Reference, which contains the ID linked to the transaction, whether it is a purchase or sale.
The Product field shows the product name along with its code, while the Lot/Serial Number identifies the specific batch or serial number. The Company field displays the company involved in the transaction.
The Moved Quantity shows how much product was moved—positive values mean incoming stock (purchase), and negative values mean outgoing stock (sale). The Remaining Quantity indicates the quantity left after the movement; a positive value represents incoming stock and a zero value represents outgoing stock.
The Unit Value shows the purchase cost per unit, and the Unit of Measure indicates how the product is measured, such as pieces or kilograms. The Total Value is calculated by multiplying the unit value by the remaining quantity.
The Description includes the reference number along with the product name. Lastly, the Remaining Value represents the remaining value of the product, including any freight or additional charges added during the Goods Receipt (GR) process.
Viewing and Exporting the Report
The Stock Valuation Report can be viewed in two main formats.
The List View displays the data in a tabular format, showing each transaction or record in rows, with columns for various data fields such as Date, Cashier, Paid Amount, and so on.
The Pivot View organizes the data into a more dynamic, summarized format. It allows you to group data by different dimensions (e.g., quantity & total value) and aggregate the values (e.g., total product )

Users can export this report to Excel for further analysis. After applying filters or group options, clicking the Export All button will download the report with the selected data in Excel format.