How to View the Inventory Aging Report in Odoo
The Inventory Aging Report in Odoo helps understand how long products have been stored in the warehouse. It separates items based on how long they have remained in stock, making it easier to find slow-moving or old products. This report is useful for managing stock levels, improving cash flow, and making better purchasing decisions.
Accessing the Inventory Aging Report
The report can be opened by logging in with the Inventory Manager role and going to the Inventory module. From the top menu, the Reporting option provides access to the Inventory Aging Report. This report presents details about how long items have been in stock and shows product-wise aging information.
Navigation path:Inventory → Reporting → Inventory Aging Report.


Search, Filter, and Group Options
The quick search area allows filtering the report by date, product, category, and company. A special option called Valuation at Date calculates stock value and aging for the selected date.
Filters such as Incoming, Outgoing, and Has Remaining Qty help focus on received products, delivered products, or items that still have quantity in stock.

Grouping options make the report more organized. Data can be grouped by product, product category, date, company, or lot/serial number. These groupings help analyze inventory from different viewpoints, such as by product type or by stock movement date.

Fields Displayed in the Inventory Aging Report
The report shows detailed information for each stock entry. The Company field indicates which company owns the stock. Created On shows when the stock record was made. Currency displays the currency used for valuation. The Description field contains details related to the product entry.
The Lot/Serial Number field provides tracking information for specific batches or items. The Product field shows the name of the item in stock. Quantity indicates the amount received or moved, while Remaining Qty shows how much is still in stock. Reference displays related documents like receipts or purchase orders.
Valuation details such as Remaining Value, Total Value, Unit of Measure, and Unit Value help understand the cost and worth of the inventory.

Views and Data Presentation
The Inventory Aging Report can be viewed in Pivot View, List View, and Graph View.
In Pivot View, data appears in a flexible table format where fields like product, category, date, company, and lot/serial number can be arranged to analyze stock aging. Values such as quantity, remaining quantity, unit value, remaining value, and total value are displayed. Pivot View also supports drag-and-drop grouping and allows exporting data for offline analysis.
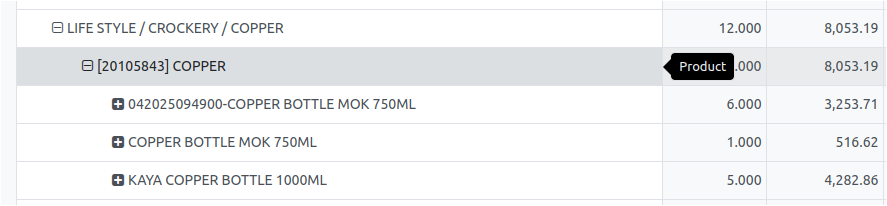
In List View, the report shows each inventory record in a row, with details such as company, created date, currency, description, lot/serial number, product, quantity, reference, remaining quantity, remaining value, total value, unit measure, and unit value. This view is useful for scanning and sorting detailed aging information.

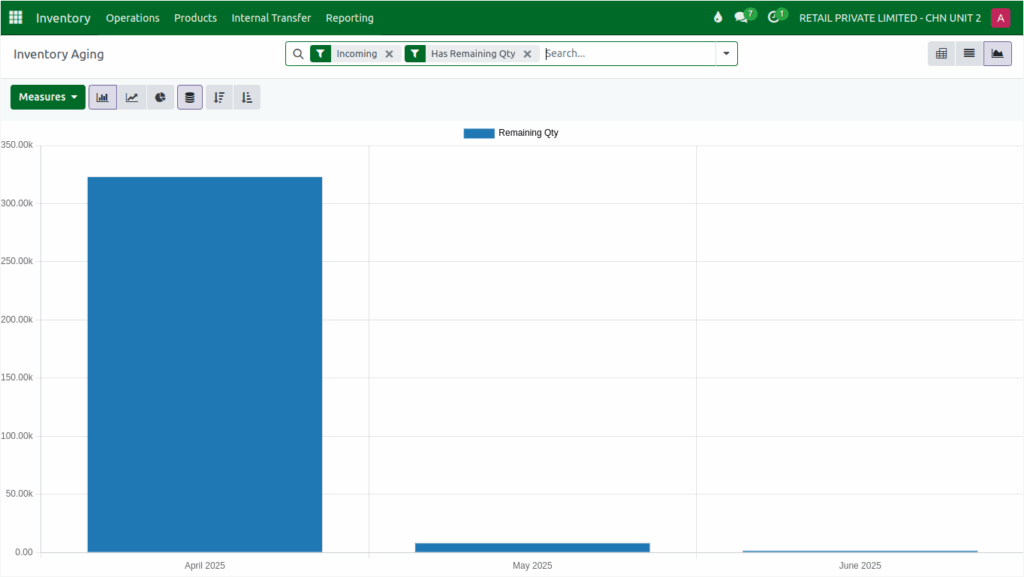
In Graph View, inventory aging information is shown visually through bar charts, line graphs, or area charts. Grouping by product, category, date, company, or lot/serial number helps highlight trends and aging patterns.
Exporting the Inventory Aging Report
The report can be exported in formats like Excel or CSV for further analysis. Before exporting, filters can be applied and specific fields selected. Exported data is helpful for offline review, sharing with teams, and integrating with other tools.