How to view Sales Attribute Report in Adempiere Retail
A Sales Attribute Report is a summary or breakdown of sales data categorized by specific attributes or characteristics related to the products or sales transactions.
User Access
Who Can Access
- Admin
- Cashier
- Sales Manager
- Manager
What User Can Do
- Analyze Product Performance by Attribute
- Customize Marketing Campaigns
- Improve Product Development
- Segment Customers
- Optimize Pricing
Prerequisite Activities
- Relevant Sales Attributes
- Reporting Period
- Validate Data Quality
Business Rules
- Attribute Definition and Standardization
- Accurate Data Entry
- One Attribute Value per Transaction Item
- Reporting Period Consistency
User Interface
Step 1 : Select ‘Sales Attribute Report ’ in Menu -> Sales reports > Manager report > Sales Attribute Report or Search Sales Attribute Report.

Step 2 : Select the date range and attribute to open the Sales Attribute Report.
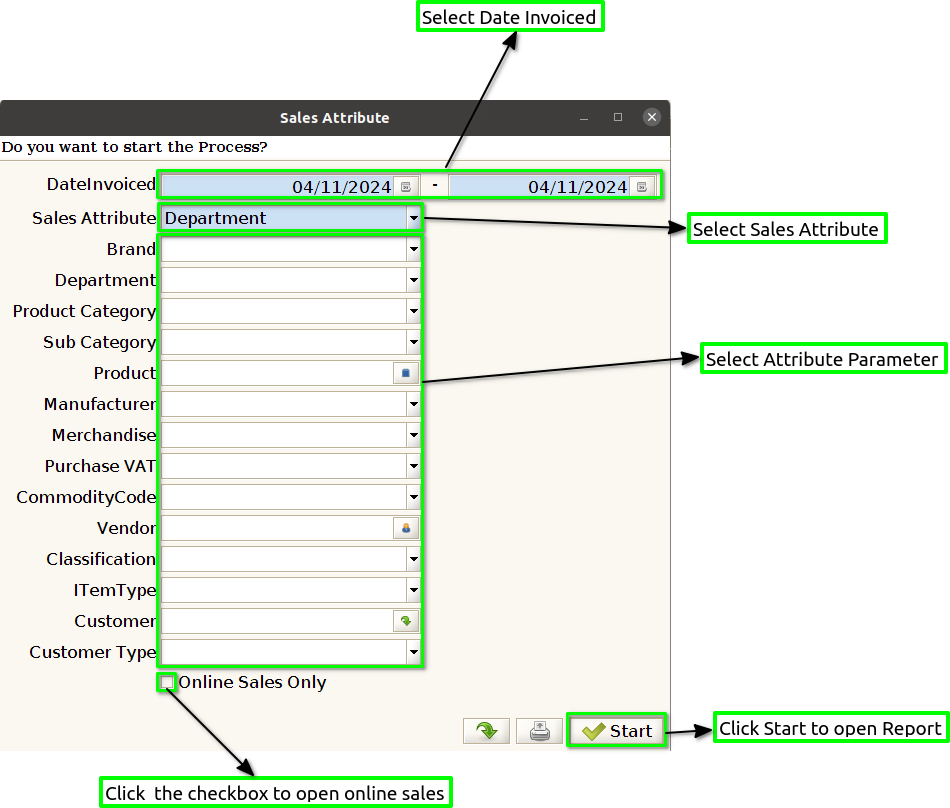
Step 3 : To view a preview of the Sales Attribute Report.
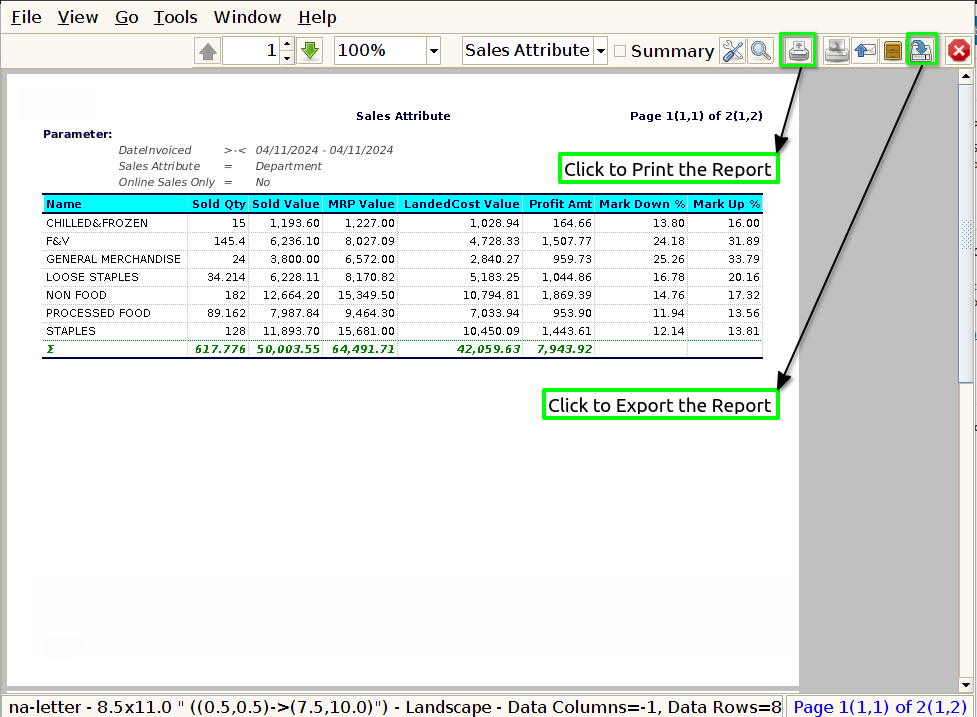
Date invoice : The inclusion of a date in a Sales Attribute Report is essential for several reasons, as it helps to provide context and allow for meaningful analysis of sales performance over time.
Name : Including the name (typically referring to product name, attribute name, or department name) in a Sales Attribute Report is important for several key reasons. It provides clear context for the
sales data and enables businesses to identify and analyze sales performance based on specific products, attributes, or categories.
Sold Quantity : Showing sold quantity in a Sales Attribute Report is crucial for providing a comprehensive understanding of how a specific product, product variant, or product attribute (such as size, color, or brand) is performing in terms of units sold.
Sold Value : The sold value provides direct insight into the revenue generated from the sale of specific products or attributes over a given period. This allows businesses to track their financial performance at a granular level.
MRP Value : Showing the MRP value alongside the actual selling price helps businesses analyze how much discount or deviation is being applied from the retail price.
Net Value : The Net Value reflects the true revenue a business earns from sales transactions, taking into account any discounts, promotions, returns, and tax adjustments.
Profit : In a Sales Attribute Report, Profit typically refers to the amount of money the business earns from the sale of products after accounting for the cost of goods sold (COGS) or cost of sales.
Mark Down % : In a Sales Attribute Report, Markdown % typically refers to the percentage reduction from the original or list price of a product to the actual selling price. It is an important metric for assessing how much a product’s price has been discounted, usually as part of a sales promotion, clearance, or price adjustment strategy.
Mark Up % : In a Sales Attribute Report, Markup % is a key metric that shows the percentage difference between the cost price (or cost of goods sold – COGS) and the selling price of a product.
Contribution % : In a Sales Attribute Report, Contribution % refers to the percentage that each product, department, or category contributes to the overall sales, profit, or other relevant financial
metrics.
Margin by WALC : In the Sales Attribute Report, Margin by WALC (also known as Margin by Weighted Average Landed Cost) typically refers to the profit margin calculated using the weighted average landed cost (WALC) of products.