How to Configure the Chart Window in iDempiere
Learn how to configure the Chart window in iDempiere to build retail sales dashboards with data-driven charts and KPIs.
Introduction
The Chart window in iDempiere lets administrators build data-driven visualizations directly from any transactional table using SQL, without custom coding.
Once configured, it feeds Dashboard Content widgets so store managers and executives see live sales trends and performance without running manual reports.
Process Flow
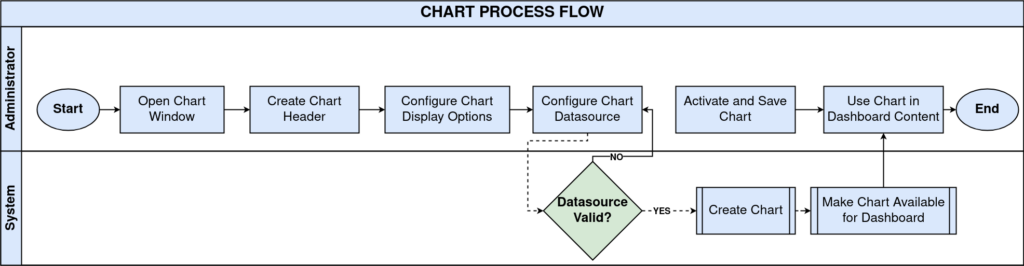
Business Rules
- Only Active charts are available for selection in Dashboard Content.
- Sql WHERE should include AD_Client_ID so data stays specific to the tenant.
- Chart Type controls how data is displayed: Line, Bar, Area, or Pie.
- Each Chart header can have one Datasource detail line defining its query.
- Window Height controls how large the chart appears on the Home dashboard.
Prerequisites
- Sales Order, Invoice, or relevant transactional data already recorded in the system.
- Role has read access to the source table used in the chart query.
- Dashboard Content window accessible for mapping the chart to the Home screen.
- Basic SQL knowledge to define the Sql FROM and Sql WHERE clauses.
Navigation
Path: Menu → Performance Analysis and Accounting → Performance Management → Chart
Configuration Steps
Step 1: Create the Chart Header Record
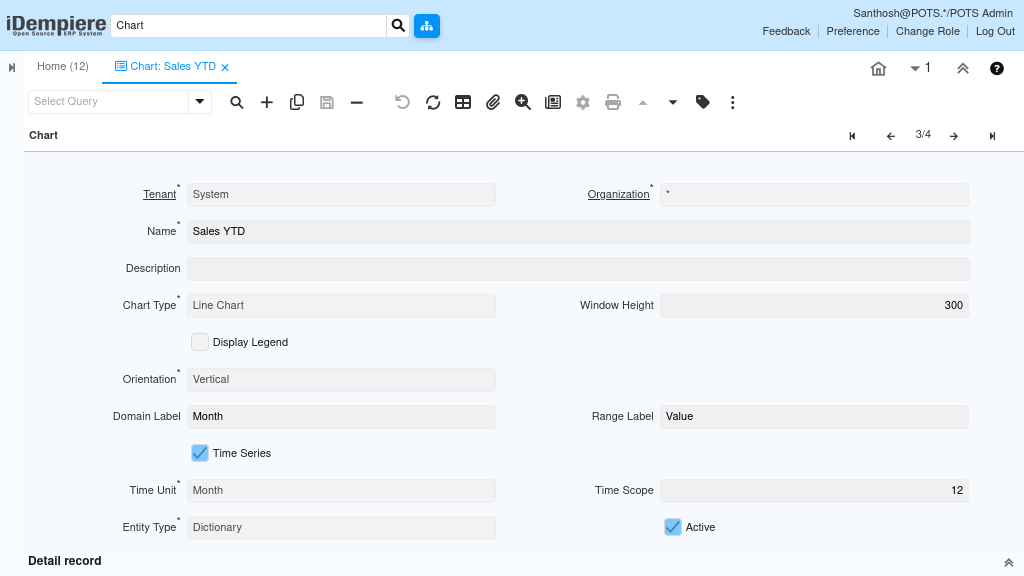
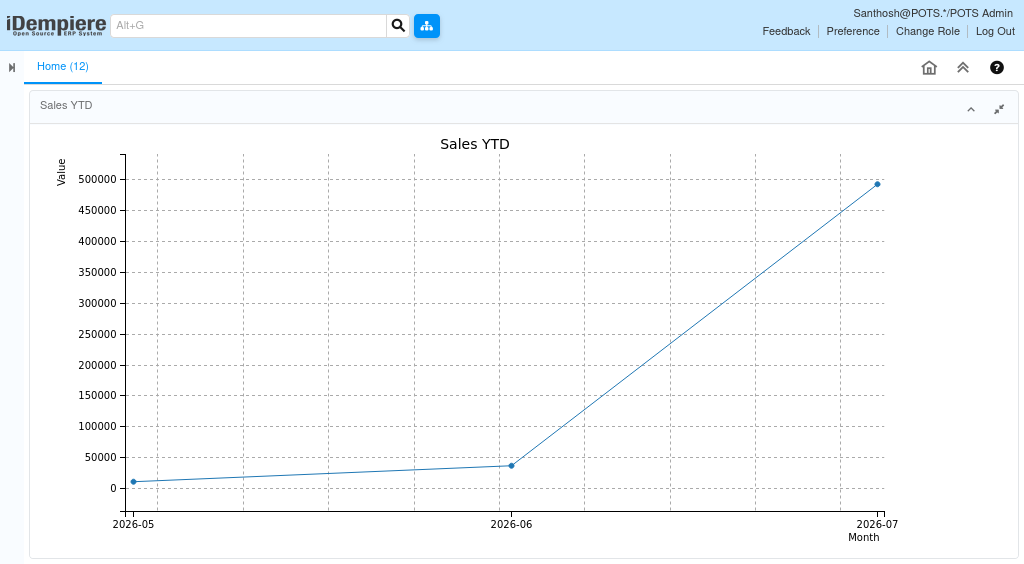
In the Chart tab, enter a Name such as “Sales YTD”, set Chart Type to Line Chart, set Orientation to Vertical, and enable Time Series for a month-wise trend.
| Field | Sample Value | Purpose |
| Name | Sales YTD | Identifies the chart in the Dashboard Content list |
| Chart Type | Line Chart | Defines the visual representation of the data |
| Window Height | 300 | Sets the chart display height in pixels |
| Orientation | Vertical | Sets the chart axis orientation |
| Domain Label | Month | Labels the X-axis of the chart |
| Range Label | Value | Labels the Y-axis of the chart |
| Time Series | Checked | Enables date-based trend plotting |
| Time Unit | Month | Groups data points by month |
| Time Scope | 12 | Number of periods displayed on the chart |
| Active | Checked | Makes the chart available for dashboard mapping |
Step 2: Define Chart Type and Display Settings
Choose a chart type matching the KPI: Line for trends, Bar for store comparisons, Pie for share of total. Enable Display Legend when the chart carries multiple series.
Step 3: Configure the Chart Datasource
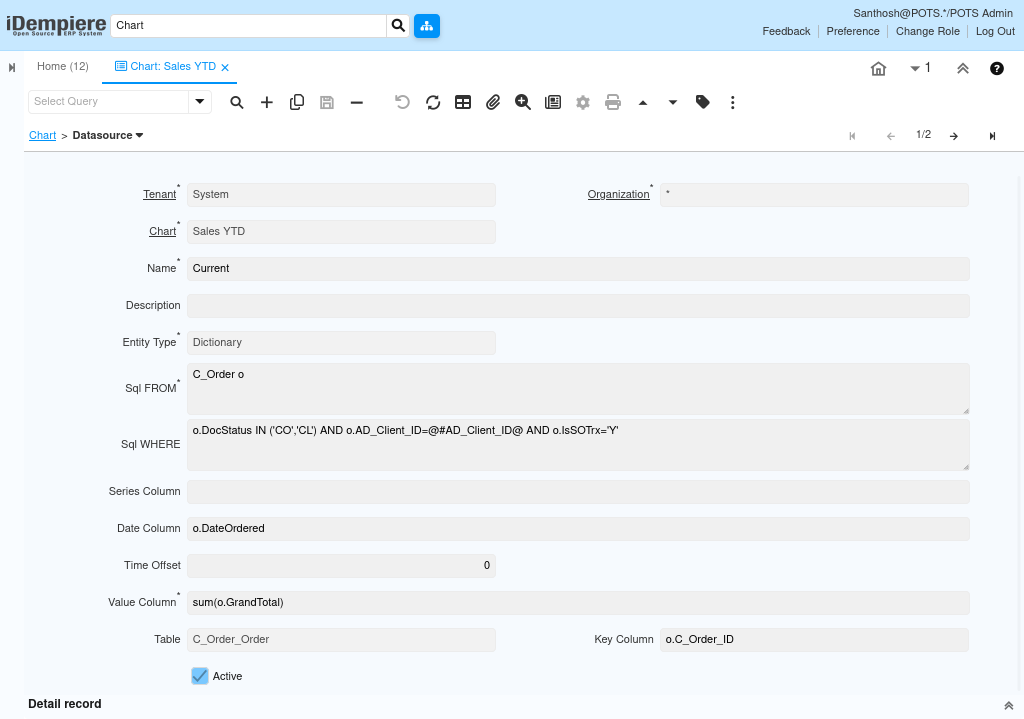
Switch to the Datasource tab and enter Sql FROM, Sql WHERE, Date Column, and Value Column so the chart pulls the correct sales figures.
| Field | Sample Value | Purpose |
| Sql FROM | C_Order o | Source table for the chart query |
| Sql WHERE | o.DocStatus IN (‘CO’,’CL’) AND o.AD_Client_ID=@#AD_Client_ID@ AND o.IsSOTrx=’Y’ | Filters completed sales orders for the current client |
| Date Column | o.DateOrdered | Column used for time-series grouping |
| Value Column | sum(o.GrandTotal) | Aggregated sales value plotted on the chart |
| Table | C_Order_Order | Reference table used for drill-down |
| Key Column | o.C_Order_ID | Unique key used for drill-down navigation |
| Series Column | (blank) | Used only when splitting the chart into multiple series |
| Time Offset | 0 | Adjusts time zone offset applied to date grouping |
Step 4: Activate and Save the Chart
Check the Active checkbox on the Chart tab and the Datasource tab, then save the record.
Common Issues and Resolutions
| Issue | Cause | Resolution |
| Chart not listed in Dashboard Content | Chart or Datasource record marked Inactive | Activate both records and save |
| Trend line not grouped by month | Time Series unchecked or Time Unit mismatch | Enable Time Series and set the correct Time Unit |
| Error when opening or saving the chart | Syntax error in Sql FROM or Sql WHERE | Test the query in the database before saving |
| Chart appears too small or too large | Window Height not set appropriately | Adjust Window Height and refresh the dashboard |
Next Steps
- Configure Dashboard Content to map this chart to the Home screen.
- Set up role-based dashboard access so the right store managers see it.
- Create additional charts for inventory levels, returns, or top-selling products.