How to Use Performance Indicator Window in iDempiere
Learn how the Performance Indicators window in iDempiere displays KPI charts for revenue and monitoring.
Introduction
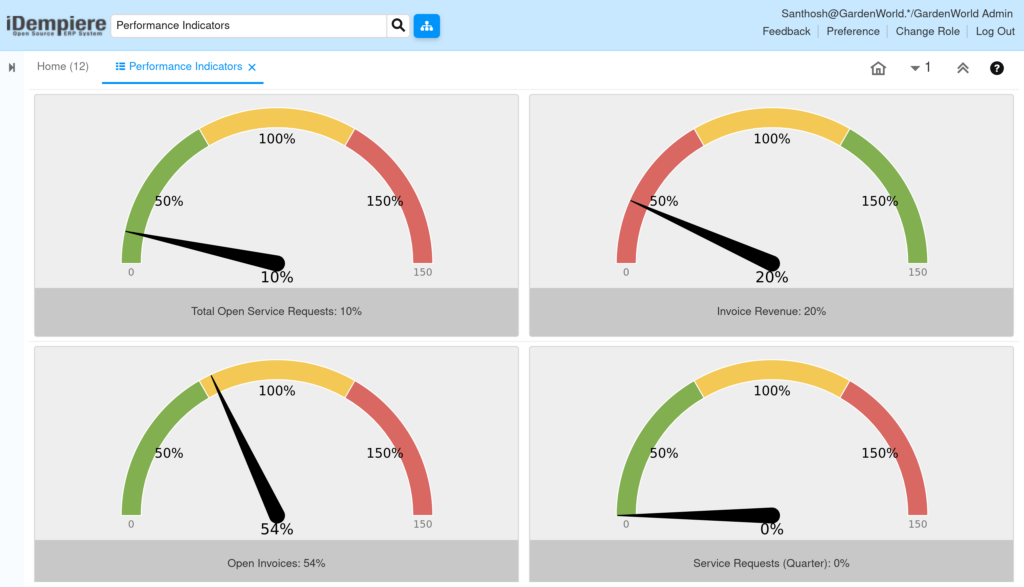
Performance Indicators is the iDempiere dashboard window that renders each active Performance Goal as a gauge, showing progress toward revenue, receivables, or other targets.
Store managers and executives use it as a daily command center to monitor sales performance and invoice exposure without opening individual transactions.
Process Flow

Business Rules
- Only Active Performance Goal records appear as gauge tiles on this window.
- Gauge needle position reflects Measure Actual as a percentage of Measure Target.
- Gauge color zones follow the Color Schema assigned to the underlying goal.
- Clicking a gauge opens its chart in a new dashboard tab.
- Chart Type can be switched on the fly without changing the saved goal record.
- The side panel table lists Measure Target, Measure Actual, and period values.
Prerequisites
- Performance Goal records configured and marked Active.
- Measure configured as the calculation source for each goal.
- Color Schema configured with Red/Yellow/Green threshold values.
- Dashboard/Role access granted to view Performance Indicators.
Navigation
Menu → Performance Analysis and Accounting → Performance Management → Performance Indicators
After opening, gauge tiles appear in a grid, one per active goal, each showing a percentage label and colored zone. Clicking a tile opens its chart in a new tab.
Configuration Steps
Step 1: Open the Dashboard and Read Gauge Tiles
Open Performance Indicators from the menu, review each gauge’s needle position and label (e.g., “Invoice Revenue: 0%”), and hover to see the tooltip with raw figures.
| Field | Sample Value | Description |
| Gauge Label | Invoice Revenue: 0% | Shows the goal name and percentage of target reached |
| Tooltip | Open Invoices max $1000: 0 of 1,000 | Shows the raw Measure Actual vs Measure Target values |
| Color Zone | Red / Yellow / Green | Visual indicator of performance status |
Step 2: Drill Down into the Underlying Chart
Click a gauge tile to open a new tab (e.g., “Invoice Revenue”) displaying the detailed chart for that goal.
| Field | Sample Value | Description |
| Chart Title | Invoices Gross Revenue | Names the chart being viewed |
| Tab Name | Invoice Revenue | New tab opened for the drill-down view |

Step 3: Switch Chart Type for Analysis
Use the dropdown above the chart to select Area, Bar, Line, Pie, Ring, or Waterfall, and watch the visualization update immediately.
| Field | Sample Value | Description |
| Chart Type Dropdown | Bar Chart (default) | Changes the chart visualization style |
| Available Options | Area / Bar / Line / Pie / Ring / Waterfall | Lets users pick the best view for analysis |
Step 4: Review the Side Panel Data Table
Check the side panel for Measure Target, Measure Actual, and the Month breakdown listing values for each period.
| Field | Sample Value | Description |
| Measure Target | 100,000.00 | Target value set for the goal |
| Measure Actual | 210.50 | Current calculated value |
| Month | 02/2002, 08/2002, 11/2003, 04/2026, 05/2026 | Period-by-period values feeding the chart |
Common Issues and Resolutions
| Issue | Cause | Resolution |
| Gauge frozen at 0% | Underlying goal’s Measure Actual hasn’t recalculated | Refresh the dashboard or wait for the scheduled recalculation |
| Gauge missing from dashboard | Goal is inactive or Role restricts visibility | Verify the goal is Active and check Role assignment |
| Drill-down click does nothing | Chart Type not set on the linked goal record | Set Chart Type on the Performance Goal record |
| Chart Type change lost after reopening | Dropdown only changes the current view, not the saved default | Update Chart Type on the goal record to persist it |
| Side panel table appears empty | Measure not returning period data | Confirm Measure Scope and Measure Display are set correctly |
| Colors don’t match expected thresholds | Color Schema is misconfigured | Review the Red/Yellow/Green boundaries in Color Schema |
Next Steps
- Configure additional Performance Goal records to add new gauges.
- Configure Color Schema for consistent visual thresholds.
- Assign goals to specific Roles for targeted dashboard views.
- Review Dashboard Content setup for broader dashboard layout.